

































| Player | # | POS | CON | CK | FG | DI | SK | ST | EN | DU | PH | FO | PA | SC | DF | PS | EX | LD | PO | MO | OV | AGE | CONTRACT | |||
|---|---|---|---|---|---|---|---|---|---|---|---|---|---|---|---|---|---|---|---|---|---|---|---|---|---|---|
 Chris Tierney | 0 | C | 100.00 | 65 | 44 | 83 | 64 | 70 | 62 | 75 | 60 | 72 | 68 | 60 | 68 | 57 | 71 | 60 | 0 | 50 | 67 | 29 | 750,000$/1yrs | |||
 Zach Sanford | 12 | LW | 100.00 | 65 | 58 | 75 | 60 | 72 | 66 | 73 | 59 | 61 | 62 | 60 | 64 | 55 | 66 | 60 | 0 | 50 | 65 | 29 | 850,000$/1yrs | |||
 Joe Snively | 92 | C | 100.00 | 57 | 54 | 73 | 59 | 61 | 61 | 58 | 58 | 55 | 61 | 59 | 65 | 56 | 61 | 58 | 0 | 50 | 63 | 28 | 800,000$/2yrs | |||
 Josh Dunne | 2 | C | 100.00 | 56 | 58 | 64 | 60 | 70 | 65 | 63 | 58 | 69 | 57 | 60 | 59 | 55 | 60 | 56 | 0 | 50 | 63 | 25 | 874,125$/2yrs | |||
 Peter Abbandonato | 50 | C | 100.00 | 54 | 56 | 67 | 60 | 62 | 65 | 63 | 61 | 70 | 60 | 57 | 61 | 54 | 60 | 56 | 0 | 50 | 63 | 26 | 750,000$/1yrs | |||
 Will Cuylle | 0 | LW | 100.00 | 55 | 57 | 62 | 60 | 65 | 63 | 62 | 59 | 55 | 57 | 60 | 60 | 58 | 54 | 53 | 0 | 50 | 62 | 22 | 902,500$/2yrs | |||
 Bryce Kindopp | 9 | RW | 100.00 | 54 | 54 | 66 | 58 | 63 | 67 | 64 | 56 | 55 | 56 | 57 | 58 | 54 | 58 | 55 | 0 | 50 | 61 | 24 | 925,000$/1yrs | |||
 Cole Guttman (R) | 0 | C | 100.00 | 55 | 50 | 68 | 58 | 55 | 61 | 56 | 57 | 68 | 58 | 60 | 59 | 57 | 55 | 53 | 0 | 50 | 61 | 25 | 950,000$/1yrs | |||
 Hudson Elynuik | 0 | C | 100.00 | 57 | 56 | 63 | 57 | 68 | 63 | 62 | 57 | 55 | 56 | 56 | 61 | 54 | 62 | 57 | 0 | 50 | 61 | 26 | 750,000$/1yrs | |||
 Brayden Burke | 33 | C/LW | 100.00 | 55 | 54 | 67 | 56 | 57 | 58 | 57 | 56 | 55 | 56 | 55 | 61 | 54 | 62 | 57 | 0 | 50 | 60 | 27 | 750,000$/1yrs | |||
 Tye Felhaber | 0 | C/LW | 100.00 | 54 | 54 | 68 | 56 | 60 | 58 | 57 | 55 | 55 | 55 | 56 | 60 | 54 | 60 | 56 | 0 | 50 | 60 | 25 | 750,000$/1yrs | |||
 Milos Kelemen | 0 | LW | 100.00 | 55 | 58 | 65 | 55 | 68 | 62 | 60 | 55 | 51 | 56 | 56 | 56 | 51 | 55 | 53 | 0 | 50 | 60 | 24 | 817,500$/2yrs | |||
 Dylan Samberg | 0 | D | 100.00 | 67 | 62 | 79 | 64 | 81 | 68 | 69 | 57 | 40 | 66 | 58 | 81 | 54 | 57 | 57 | 0 | 50 | 69 | 25 | 1,175,000$/3yrs | |||
 Connor MacKey | 0 | D | 100.00 | 67 | 73 | 72 | 69 | 72 | 68 | 62 | 58 | 40 | 67 | 59 | 73 | 54 | 57 | 58 | 0 | 50 | 68 | 27 | 912,500$/4yrs | |||
 Christian Wolanin | 86 | D | 100.00 | 56 | 53 | 70 | 61 | 65 | 65 | 60 | 60 | 40 | 63 | 55 | 64 | 54 | 64 | 59 | 0 | 50 | 64 | 29 | 750,000$/3yrs | |||
 Brayden Pachal | 10 | D | 100.00 | 59 | 53 | 62 | 60 | 66 | 66 | 64 | 56 | 40 | 58 | 55 | 63 | 54 | 58 | 55 | 0 | 50 | 62 | 24 | 750,000$/3yrs | |||
 Joshua Anderson | 0 | D | 100.00 | 80 | 43 | 83 | 51 | 89 | 60 | 65 | 51 | 30 | 50 | 54 | 57 | 45 | 65 | 63 | 0 | 50 | 61 | 25 | 750,000$/1yrs | |||
 Luke Martin (R) | 0 | D | 100.00 | 55 | 54 | 67 | 55 | 70 | 58 | 58 | 55 | 40 | 55 | 54 | 62 | 54 | 60 | 56 | 0 | 50 | 60 | 25 | 750,000$/1yrs | |||
| Scratches | ||||||||||||||||||||||||||
 Brandon Biro | 8 | C | 100.00 | 54 | 58 | 67 | 58 | 57 | 63 | 62 | 61 | 66 | 60 | 59 | 62 | 54 | 60 | 56 | 0 | 50 | 63 | 26 | 763,889$/2yrs | |||
 Adam Raska | 6 | RW | 100.00 | 57 | 53 | 61 | 57 | 60 | 64 | 63 | 56 | 55 | 56 | 55 | 60 | 54 | 55 | 53 | 0 | 50 | 60 | 22 | 900,000$/2yrs | |||
 Brett Kemp | 0 | C | 100.00 | 56 | 54 | 68 | 54 | 61 | 55 | 55 | 54 | 66 | 54 | 54 | 61 | 54 | 56 | 54 | 0 | 50 | 59 | 24 | 750,000$/1yrs | |||
 Pierrick Dube | 0 | RW | 100.00 | 52 | 55 | 63 | 58 | 53 | 59 | 58 | 56 | 52 | 54 | 57 | 59 | 54 | 52 | 50 | 0 | 50 | 59 | 23 | 950,000$/3yrs | |||
 Alex Kannok Leipert | 17 | D | 100.00 | 63 | 39 | 74 | 55 | 72 | 65 | 69 | 54 | 30 | 53 | 52 | 56 | 45 | 62 | 64 | 0 | 50 | 60 | 23 | 750,000$/1yrs | |||
 Jake Livingstone | 0 | D | 100.00 | 54 | 38 | 70 | 52 | 75 | 68 | 54 | 50 | 38 | 57 | 50 | 66 | 51 | 51 | 55 | 0 | 50 | 60 | 25 | 2,130,000$/3yrs | |||
 Mason Lohrei (R) | 0 | D | 100.00 | 52 | 51 | 65 | 51 | 66 | 52 | 52 | 51 | 38 | 51 | 51 | 57 | 51 | 52 | 50 | 0 | 50 | 56 | 23 | 1,050,000$/3yrs | |||
| Priority | Type | Description |
|---|---|---|
| 1 | | or OR | Logical "or" (Vertical bar). Filter the column for content that matches text from either side of the bar |
| 2 | && or AND | Logical "and". Filter the column for content that matches text from either side of the operator. |
| 3 | /\d/ | Add any regex to the query to use in the query ("mig" flags can be included /\w/mig) |
| 4 | < <= >= > | Find alphabetical or numerical values less than or greater than or equal to the filtered query |
| 5 | ! or != | Not operator, or not exactly match. Filter the column with content that do not match the query. Include an equal (=), single (') or double quote (") to exactly not match a filter. |
| 6 | " or = | To exactly match the search query, add a quote, apostrophe or equal sign to the beginning and/or end of the query |
| 7 | - or to | Find a range of values. Make sure there is a space before and after the dash (or the word "to") |
| 8 | ? | Wildcard for a single, non-space character. |
| 8 | * | Wildcard for zero or more non-space characters. |
| 9 | ~ | Perform a fuzzy search (matches sequential characters) by adding a tilde to the beginning of the query |
| 10 | text | Any text entered in the filter will match text found within the column |
| Goalie | # | CON | SK | DU | EN | SZ | AG | RB | SC | HS | RT | PH | PS | EX | LD | PO | MO | OV | AGE | CONTRACT |
|---|---|---|---|---|---|---|---|---|---|---|---|---|---|---|---|---|---|---|---|---|
 Logan Thompson | 31 | 100.00 | 75 | 74 | 74 | 81 | 72 | 73 | 81 | 73 | 77 | 78 | 81 | 59 | 55 | 0 | 50 | 76 | 27 | 766,667$/3yrs |
 Jiri Patera | 0 | 100.00 | 60 | 61 | 61 | 67 | 66 | 56 | 66 | 63 | 59 | 59 | 58 | 58 | 54 | 0 | 50 | 63 | 25 | 800,000$/2yrs |
| Scratches | ||||||||||||||||||||
 Jett Alexander | 0 | 100.00 | 67 | 52 | 52 | 86 | 58 | 63 | 52 | 68 | 62 | 53 | 53 | 52 | 52 | 0 | 50 | 62 | 24 | 775,000$/1yrs |
 Tommy Nappier | 0 | 100.00 | 56 | 56 | 56 | 69 | 65 | 55 | 67 | 56 | 58 | 56 | 64 | 60 | 55 | 0 | 50 | 60 | 25 | 750,000$/1yrs |
| Coaches Name | PH | DF | OF | PD | EX | LD | PO | CNT | Age | Contract | Salary |
|---|---|---|---|---|---|---|---|---|---|---|---|
| Chris Niel | 75 | 75 | 75 | 75 | 75 | 75 | 75 | Can | 44 | 5 | 0$ |
| General Manager |
|---|
| Priority | Type | Description |
|---|---|---|
| 1 | | or OR | Logical "or" (Vertical bar). Filter the column for content that matches text from either side of the bar |
| 2 | && or AND | Logical "and". Filter the column for content that matches text from either side of the operator. |
| 3 | /\d/ | Add any regex to the query to use in the query ("mig" flags can be included /\w/mig) |
| 4 | < <= >= > | Find alphabetical or numerical values less than or greater than or equal to the filtered query |
| 5 | ! or != | Not operator, or not exactly match. Filter the column with content that do not match the query. Include an equal (=), single (') or double quote (") to exactly not match a filter. |
| 6 | " or = | To exactly match the search query, add a quote, apostrophe or equal sign to the beginning and/or end of the query |
| 7 | - or to | Find a range of values. Make sure there is a space before and after the dash (or the word "to") |
| 8 | ? | Wildcard for a single, non-space character. |
| 8 | * | Wildcard for zero or more non-space characters. |
| 9 | ~ | Perform a fuzzy search (matches sequential characters) by adding a tilde to the beginning of the query |
| 10 | text | Any text entered in the filter will match text found within the column |
| # | Player Name | Team Name | # | POS | GP | G | A | P | +/- | PIM | PIM5 | HIT | SHT | OSB | OSM | SHT% | SB | MP | PPG | PPA | PPP | PKG | PKA | PKP | PKM | GW | GT | FO% | EG | HT | P/GP | PSG | PSS | GSAVG | ||
|---|---|---|---|---|---|---|---|---|---|---|---|---|---|---|---|---|---|---|---|---|---|---|---|---|---|---|---|---|---|---|---|---|---|---|---|---|
| 1 | Joe Snively |  Binghamton Senateurs (OTT) | C | 12 | 3 | 7 | 10 | 1 | 4 | 0 | 14 | 34 | 10 | 18 | 8.82% | 2 | 15.53 | 0 | 2 | 2 | 0 | 0 | 0 | 5 | 0 | 0 | 47.37% | 0 | 0 | 0.83 | 0 | 0 | 0.80 | |||
| 2 | Dylan Samberg | Binghamton Senateurs (OTT) | D | 12 | 3 | 7 | 10 | 1 | 6 | 0 | 29 | 28 | 9 | 17 | 10.71% | 27 | 23.29 | 2 | 0 | 2 | 0 | 0 | 0 | 34 | 1 | 1 | 0.00% | 0 | 0 | 0.83 | 0 | 0 | 0.86 | |||
| 3 | Will Cuylle | Binghamton Senateurs (OTT) | LW | 12 | 3 | 6 | 9 | -1 | 4 | 0 | 17 | 38 | 9 | 16 | 7.89% | 1 | 17.40 | 1 | 3 | 4 | 0 | 0 | 0 | 0 | 2 | 0 | 66.67% | 0 | 0 | 0.75 | 0 | 0 | 0.73 | |||
| 4 | Josh Dunne | Binghamton Senateurs (OTT) | C | 12 | 4 | 5 | 9 | 0 | 6 | 0 | 22 | 30 | 9 | 25 | 13.33% | 1 | 20.02 | 2 | 2 | 4 | 0 | 0 | 0 | 29 | 0 | 0 | 54.64% | 0 | 0 | 0.75 | 0 | 0 | 0.68 | |||
| 5 | Christian Wolanin | Binghamton Senateurs (OTT) | D | 12 | 3 | 5 | 8 | -1 | 6 | 0 | 15 | 24 | 7 | 13 | 12.50% | 15 | 22.97 | 2 | 1 | 3 | 0 | 0 | 0 | 33 | 0 | 0 | 0.00% | 0 | 0 | 0.67 | 0 | 0 | 0.59 | |||
| 6 | Tye Felhaber | Binghamton Senateurs (OTT) | C/LW | 12 | 2 | 5 | 7 | 5 | 10 | 0 | 16 | 10 | 3 | 11 | 20.00% | 1 | 12.39 | 0 | 0 | 0 | 0 | 0 | 0 | 0 | 0 | 0 | 25.00% | 0 | 0 | 0.58 | 0 | 0 | 0.50 | |||
| 7 | Adam Raska | Binghamton Senateurs (OTT) | RW | 7 | 2 | 4 | 6 | 1 | 2 | 0 | 16 | 20 | 4 | 13 | 10.00% | 1 | 17.26 | 0 | 1 | 1 | 0 | 0 | 0 | 0 | 1 | 0 | 45.45% | 0 | 0 | 0.86 | 0 | 0 | 0.89 | |||
| 8 | Joshua Anderson | Binghamton Senateurs (OTT) | D | 12 | 1 | 5 | 6 | 3 | 10 | 0 | 34 | 13 | 3 | 7 | 7.69% | 13 | 19.83 | 0 | 1 | 1 | 0 | 0 | 0 | 24 | 0 | 0 | 0.00% | 0 | 0 | 0.50 | 0 | 0 | 0.49 | |||
| 9 | Peter Abbandonato | Binghamton Senateurs (OTT) | C | 12 | 3 | 3 | 6 | 4 | 4 | 0 | 13 | 27 | 8 | 28 | 11.11% | 4 | 16.40 | 0 | 0 | 0 | 0 | 0 | 0 | 36 | 0 | 0 | 50.00% | 0 | 0 | 0.50 | 0 | 0 | 0.62 | |||
| 10 | Chris Tierney | Binghamton Senateurs (OTT) | C | 12 | 0 | 5 | 5 | -7 | 6 | 0 | 21 | 28 | 9 | 25 | 0.00% | 5 | 22.06 | 0 | 1 | 1 | 0 | 0 | 0 | 34 | 0 | 0 | 53.80% | 0 | 0 | 0.42 | 0 | 0 | 0.21 | |||
| 11 | Hudson Elynuik | Binghamton Senateurs (OTT) | C | 12 | 2 | 3 | 5 | 6 | 4 | 0 | 14 | 13 | 3 | 10 | 15.38% | 1 | 9.68 | 0 | 1 | 1 | 0 | 0 | 0 | 3 | 0 | 0 | 47.06% | 0 | 0 | 0.42 | 0 | 0 | 0.51 | |||
| 12 | Brandon Biro | Binghamton Senateurs (OTT) | C | 8 | 2 | 2 | 4 | 1 | 19 | 5 | 11 | 9 | 2 | 4 | 22.22% | 4 | 14.39 | 0 | 0 | 0 | 0 | 0 | 0 | 11 | 0 | 0 | 58.82% | 0 | 0 | 0.50 | 0 | 0 | 0.10 | |||
| 13 | Connor MacKey | Binghamton Senateurs (OTT) | D | 5 | 1 | 3 | 4 | -2 | 2 | 0 | 12 | 9 | 3 | 6 | 11.11% | 3 | 19.20 | 0 | 2 | 2 | 0 | 0 | 0 | 13 | 0 | 0 | 0.00% | 0 | 0 | 0.80 | 0 | 0 | 0.53 | |||
| 14 | Cole Guttman | Binghamton Senateurs (OTT) | C | 12 | 4 | 0 | 4 | 4 | 2 | 0 | 6 | 9 | 2 | 8 | 44.44% | 0 | 5.76 | 0 | 0 | 0 | 0 | 0 | 0 | 0 | 0 | 0 | 53.85% | 0 | 1 | 0.33 | 0 | 0 | 0.40 | |||
| 15 | Brayden Pachal | Binghamton Senateurs (OTT) | D | 8 | 1 | 3 | 4 | 0 | 8 | 0 | 10 | 5 | 5 | 6 | 20.00% | 14 | 19.09 | 1 | 0 | 1 | 0 | 0 | 0 | 15 | 0 | 0 | 0.00% | 0 | 0 | 0.50 | 0 | 0 | 0.33 | |||
| 16 | Brayden Burke | Binghamton Senateurs (OTT) | C/LW | 12 | 1 | 2 | 3 | 4 | 0 | 0 | 6 | 5 | 2 | 11 | 20.00% | 0 | 7.01 | 0 | 0 | 0 | 0 | 0 | 0 | 4 | 0 | 0 | 100.00% | 0 | 0 | 0.25 | 0 | 0 | 0.34 | |||
| 17 | Alex Kannok Leipert | Binghamton Senateurs (OTT) | D | 4 | 0 | 2 | 2 | -1 | 0 | 0 | 7 | 4 | 0 | 2 | 0.00% | 2 | 17.36 | 0 | 0 | 0 | 0 | 0 | 0 | 6 | 0 | 0 | 0.00% | 0 | 0 | 0.50 | 0 | 0 | 0.39 | |||
| 18 | Zach Sanford | Binghamton Senateurs (OTT) | LW | 12 | 2 | 0 | 2 | -9 | 8 | 0 | 28 | 26 | 14 | 26 | 7.69% | 4 | 19.30 | 0 | 0 | 0 | 0 | 0 | 0 | 34 | 2 | 0 | 29.41% | 0 | 0 | 0.17 | 0 | 0 | 0.02 | |||
| 19 | Bryce Kindopp | Binghamton Senateurs (OTT) | RW | 12 | 0 | 0 | 0 | -8 | 4 | 0 | 12 | 10 | 12 | 12 | 0.00% | 3 | 16.47 | 0 | 0 | 0 | 0 | 0 | 0 | 1 | 0 | 0 | 47.06% | 0 | 0 | 0.00 | 0 | 0 | -0.16 | |||
| 20 | Luke Martin | Binghamton Senateurs (OTT) | D | 11 | 0 | 0 | 0 | 0 | 6 | 0 | 13 | 7 | 3 | 7 | 0.00% | 19 | 18.64 | 0 | 0 | 0 | 0 | 0 | 0 | 25 | 0 | 0 | 0.00% | 0 | 0 | 0.00 | 0 | 0 | 0.06 | |||
| 21 | Jake Livingstone | Binghamton Senateurs (OTT) | D | 1 | 0 | 0 | 0 | -2 | 0 | 0 | 0 | 0 | 0 | 2 | 0.00% | 2 | 17.80 | 0 | 0 | 0 | 0 | 0 | 0 | 2 | 0 | 0 | 0.00% | 0 | 0 | 0.00 | 0 | 0 | -0.63 | |||
| 22 | Milos Kelemen | Binghamton Senateurs (OTT) | LW | 4 | 0 | 0 | 0 | 0 | 0 | 0 | 2 | 1 | 1 | 1 | 0.00% | 0 | 1.11 | 0 | 0 | 0 | 0 | 0 | 0 | 0 | 0 | 0 | 0.00% | 0 | 0 | 0.00 | 0 | 0 | 0.04 | |||
| Team Total or Average | 216 | 37 | 67 | 104 | -1 | 111 | 5 | 318 | 350 | 118 | 268 | 10.57% | 122 | 16.29 | 8 | 14 | 22 | 348 | 0 | 0 | 0 | 315 | 6 | 1 | 52.29% | 1048 | 0 | 0 | 0 | 1 | 0.59 | 0 | 0 |
| Priority | Type | Description |
|---|---|---|
| 1 | | or OR | Logical "or" (Vertical bar). Filter the column for content that matches text from either side of the bar |
| 2 | && or AND | Logical "and". Filter the column for content that matches text from either side of the operator. |
| 3 | /\d/ | Add any regex to the query to use in the query ("mig" flags can be included /\w/mig) |
| 4 | < <= >= > | Find alphabetical or numerical values less than or greater than or equal to the filtered query |
| 5 | ! or != | Not operator, or not exactly match. Filter the column with content that do not match the query. Include an equal (=), single (') or double quote (") to exactly not match a filter. |
| 6 | " or = | To exactly match the search query, add a quote, apostrophe or equal sign to the beginning and/or end of the query |
| 7 | - or to | Find a range of values. Make sure there is a space before and after the dash (or the word "to") |
| 8 | ? | Wildcard for a single, non-space character. |
| 8 | * | Wildcard for zero or more non-space characters. |
| 9 | ~ | Perform a fuzzy search (matches sequential characters) by adding a tilde to the beginning of the query |
| 10 | text | Any text entered in the filter will match text found within the column |
| # | Goalie Name | Team Name | GP | W | L | OTL | PCT | GAA | MP | PIM | SO | GA | SA | SAR | A | EG | PS % | PSA | ST | BG | S1 | S2 | S3 |
|---|---|---|---|---|---|---|---|---|---|---|---|---|---|---|---|---|---|---|---|---|---|---|---|
| 1 | Logan Thompson | Binghamton Senateurs (OTT) | 12 | 6 | 5 | 1 | 0.912 | 2.96 | 689 | 0 | 0 | 34 | 385 | 0 | 0 | 0 | 0.000 | 0 | 12 | 0 | 1 | 0 | 0 |
| 2 | Jiri Patera | Binghamton Senateurs (OTT) | 1 | 0 | 0 | 0 | 1.000 | 0.00 | 30 | 0 | 0 | 0 | 17 | 0 | 0 | 0 | 0.000 | 0 | 0 | 12 | 0 | 0 | 0 |
| Team Total or Average | 13 | 6 | 5 | 1 | 0.915 | 2.83 | 720 | 0 | 0 | 34 | 402 | 0 | 0 | 0 | 0.000 | 0 | 12 | 12 | 1 | 0 | 0 |
| Player Name | POS | Age | Cap Hit | 2023-24 | 2024-25 | 2025-26 | 2026-27 | 2027-28 | 2028-29 | 2029-30 | 2030-31 |
|---|---|---|---|---|---|---|---|---|---|---|---|
Adam Raska   | RW | 22 | 900,000$ | 900,000$ | 900,000$ |  RFA | |||||
| Alex Kannok Leipert | D | 23 | 750,000$ | 750,000$ | RFA | ||||||
| Brandon Biro | C | 26 | 763,889$ | 762,500$ | 762,500$ | UFA | |||||
| Brayden Burke | C/LW | 27 | 750,000$ | 750,000$ | UFA | ||||||
| Brayden Pachal | D | 24 | 750,000$ | 750,000$ | 775,000$ | 775,000$ | UFA | ||||
| Brett Kemp | C | 24 | 750,000$ | 750,000$ | RFA | ||||||
| Bryce Kindopp | RW | 24 | 925,000$ | 925,000$ | UFA | ||||||
| Chris Tierney | C | 29 | 750,000$ | 750,000$ | UFA | ||||||
| Christian Wolanin | D | 29 | 750,000$ | 750,000$ | 775,000$ | 775,000$ | UFA | ||||
| Cole Guttman | C | 25 | 950,000$ | 950,000$ | UFA | ||||||
| Connor MacKey | D | 27 | 912,500$ | 912,500$ | 775,000$ | 775,000$ | 775,000$ | UFA | |||
| Dylan Samberg | D | 25 | 1,175,000$ | 1,175,000$ | 1,400,000$ | 1,400,000$ | UFA | ||||
| Hudson Elynuik | C | 26 | 750,000$ | 750,000$ | UFA | ||||||
| Jake Livingstone | D | 25 | 2,130,000$ | 2,130,000$ | 775,000$ | 775,000$ | UFA | ||||
| Jett Alexander | G | 24 | 775,000$ | 775,000$ | UFA | ||||||
| Jiri Patera | G | 25 | 800,000$ | 800,000$ | 775,000$ | UFA | |||||
| Joe Snively | C | 28 | 800,000$ | 800,000$ | 800,000$ | UFA | |||||
| Josh Dunne | C | 25 | 874,125$ | 874,125$ | 775,000$ | UFA | |||||
| Joshua Anderson | D | 25 | 750,000$ | 750,000$ | UFA | ||||||
| Logan Thompson | G | 27 | 766,667$ | 766,667$ | 766,667$ | 766,667$ | UFA | ||||
| Luke Martin | D | 25 | 750,000$ | 750,000$ | UFA | ||||||
| Mason Lohrei | D | 23 | 1,050,000$ | 1,050,000$ | 1,050,000$ | 1,050,000$ | UFA | ||||
| Milos Kelemen | LW | 24 | 817,500$ | 817,500$ | 817,500$ | UFA | |||||
| Peter Abbandonato | C | 26 | 750,000$ | 750,000$ | UFA | ||||||
| Pierrick Dube | RW | 23 | 950,000$ | 950,000$ | 950,000$ | 950,000$ | UFA | ||||
| Tommy Nappier | G | 25 | 750,000$ | 750,000$ | UFA | ||||||
| Tye Felhaber | C/LW | 25 | 750,000$ | 750,000$ | UFA | ||||||
| Will Cuylle | LW | 22 | 902,500$ | 902,500$ | 902,500$ | RFA | |||||
| Zach Sanford | LW | 29 | 850,000$ | 850,000$ | UFA |
| Forward Lines | |||||||
|---|---|---|---|---|---|---|---|
|
|
| |||||
|
|
| |||||
|
|
| |||||
|
|
| |||||
| Defensive Pairings | |||||||
|---|---|---|---|---|---|---|---|
|
| ||||||
|
| ||||||
|
| ||||||
| 1st Power Play Unit | |||||||
|---|---|---|---|---|---|---|---|
|
|
| |||||
|
| ||||||
| 2nd Power Play Unit | |||||||
|---|---|---|---|---|---|---|---|
|
|
| |||||
|
| ||||||
| Goalies | |||||||
|---|---|---|---|---|---|---|---|
|
| ||||||
| Priority | Type | Description |
|---|---|---|
| 1 | | or OR | Logical "or" (Vertical bar). Filter the column for content that matches text from either side of the bar |
| 2 | && or AND | Logical "and". Filter the column for content that matches text from either side of the operator. |
| 3 | /\d/ | Add any regex to the query to use in the query ("mig" flags can be included /\w/mig) |
| 4 | < <= >= > | Find alphabetical or numerical values less than or greater than or equal to the filtered query |
| 5 | ! or != | Not operator, or not exactly match. Filter the column with content that do not match the query. Include an equal (=), single (') or double quote (") to exactly not match a filter. |
| 6 | " or = | To exactly match the search query, add a quote, apostrophe or equal sign to the beginning and/or end of the query |
| 7 | - or to | Find a range of values. Make sure there is a space before and after the dash (or the word "to") |
| 8 | ? | Wildcard for a single, non-space character. |
| 8 | * | Wildcard for zero or more non-space characters. |
| 9 | ~ | Perform a fuzzy search (matches sequential characters) by adding a tilde to the beginning of the query |
| 10 | text | Any text entered in the filter will match text found within the column |
| # | VS Team | GP | W | L | T | OTW | OTL | SOW | SOL | GF | GA | Diff | P | PCT | G | A | TP | SO | EG | GP1 | GP2 | GP3 | GP4 | SHF | SH1 | SP2 | SP3 | SP4 | SHA | SHB | Pim | Hit | PPA | PPG | PP% | PKA | PK GA | PK% | PK GF | W OF FO | T OF FO | OF FO% | W DF FO | T DF FO | DF FO% | W NT FO | T NT FO | NT FO% | PZ DF | PZ OF | PZ NT | PC DF | PC OF | PC NT | GF% | SH% | SV% | PDO | PDOBRK |
|---|---|---|---|---|---|---|---|---|---|---|---|---|---|---|---|---|---|---|---|---|---|---|---|---|---|---|---|---|---|---|---|---|---|---|---|---|---|---|---|---|---|---|---|---|---|---|---|---|---|---|---|---|---|---|---|---|---|---|---|
| 1 |  Americans | 6 | 4 | 2 | 0 | 0 | 0 | 0 | 0 | 19 | 15 | 4 | 8 | 0.667 | 19 | 34 | 53 | 0 | 0 | 18 | 9 | 10 | 0 | 182 | 133 | 101 | 116 | 0 | 214 | 71 | 44 | 148 | 25 | 4 | 16.00% | 20 | 2 | 90.00% | 0 | 210 | 401 | 52.37% | 245 | 468 | 52.35% | 93 | 179 | 51.96% | 283 | 187 | 276 | 92 | 161 | 82 | 53.6% | 10.4% | 93.0% | 103.4 | LUCKY |
| 2 |  Rockets | 6 | 2 | 4 | 0 | 0 | 0 | 0 | 0 | 18 | 19 | -1 | 4 | 0.333 | 18 | 33 | 51 | 0 | 0 | 18 | 9 | 10 | 0 | 168 | 133 | 101 | 116 | 0 | 188 | 51 | 67 | 170 | 15 | 4 | 26.67% | 25 | 3 | 88.00% | 0 | 210 | 401 | 52.37% | 245 | 468 | 52.35% | 93 | 179 | 51.96% | 283 | 187 | 276 | 92 | 161 | 82 | 46.7% | 10.7% | 89.9% | 100.6 | FUN |
| _Vs Division | 12 | 6 | 6 | 0 | 0 | 0 | 0 | 0 | 37 | 34 | 3 | 12 | 0.500 | 37 | 67 | 104 | 0 | 0 | 18 | 9 | 10 | 0 | 350 | 133 | 101 | 116 | 0 | 402 | 122 | 111 | 318 | 40 | 8 | 20.00% | 45 | 5 | 88.89% | 0 | 210 | 401 | 52.37% | 245 | 468 | 52.35% | 93 | 179 | 51.96% | 283 | 187 | 276 | 92 | 161 | 82 | 50.0% | 10.6% | 91.5% | 102.1 | LUCKY | |
| _Vs Conference | 12 | 6 | 6 | 0 | 0 | 0 | 0 | 0 | 37 | 34 | 3 | 12 | 0.500 | 37 | 67 | 104 | 0 | 0 | 18 | 9 | 10 | 0 | 350 | 133 | 101 | 116 | 0 | 402 | 122 | 111 | 318 | 40 | 8 | 20.00% | 45 | 5 | 88.89% | 0 | 210 | 401 | 52.37% | 245 | 468 | 52.35% | 93 | 179 | 51.96% | 283 | 187 | 276 | 92 | 161 | 82 | 50.0% | 10.6% | 91.5% | 102.1 | LUCKY | |
| _Since Last GM Reset | 12 | 6 | 6 | 0 | 0 | 0 | 0 | 0 | 37 | 34 | 3 | 12 | 0.500 | 37 | 67 | 104 | 0 | 0 | 18 | 9 | 10 | 0 | 350 | 133 | 101 | 116 | 0 | 402 | 122 | 111 | 318 | 40 | 8 | 20.00% | 45 | 5 | 88.89% | 0 | 210 | 401 | 52.37% | 245 | 468 | 52.35% | 93 | 179 | 51.96% | 283 | 187 | 276 | 92 | 161 | 82 | 50.0% | 10.6% | 91.5% | 102.1 | LUCKY | |
| Total | 12 | 6 | 6 | 0 | 0 | 0 | 0 | 0 | 37 | 34 | 3 | 12 | 0.500 | 37 | 67 | 104 | 0 | 0 | 18 | 9 | 10 | 0 | 350 | 133 | 101 | 116 | 0 | 402 | 122 | 111 | 318 | 40 | 8 | 20.00% | 45 | 5 | 88.89% | 0 | 210 | 401 | 52.37% | 245 | 468 | 52.35% | 93 | 179 | 51.96% | 283 | 187 | 276 | 92 | 161 | 82 | 50.0% | 10.6% | 91.5% | 102.1 | LUCKY |
| Puck Time | |
|---|---|
| Offensive Zone | 23 |
| Neutral Zone | 13 |
| Defensive Zone | 23 |
| Puck Time | |
|---|---|
| Offensive Zone Start | 401 |
| Neutral Zone Start | 179 |
| Defensive Zone Start | 468 |
| Puck Time | |
|---|---|
| With Puck | 30 |
| Without Puck | 29 |
| Faceoffs | |
|---|---|
| Faceoffs Won | 548 |
| Faceoffs Lost | 500 |
| Team Average Shots after | League Average Shots after | |
|---|---|---|
| 1st Period | 11.1 | 9.57 |
| 2nd Period | 19.5 | 20.31 |
| 3rd Period | 29.2 | 30.68 |
| Overtime | 29.2 | 31.4 |
| Goals in | Team Average Goals after | League Average Goals after |
|---|---|---|
| 1st Period | 1.5 | 0.64 |
| 2nd Period | 2.3 | 1.65 |
| 3rd Period | 3.1 | 2.67 |
| Overtime | 3.1 | 2.83 |
| Even Strenght Goal | 29 |
|---|---|
| PP Goal | 8 |
| PK Goal | 0 |
| Empty Net Goal | 0 |
| Home | Away | |
|---|---|---|
| Win | 3 | 3 |
| Lost | 3 | 3 |
| Overtime Lost | 0 | 0 |
| PP Attempt | 40 |
|---|---|
| PP Goal | 8 |
| PK Attempt | 45 |
| PK Goal Against | 5 |
| Home | |
|---|---|
| Shots For | 29.2 |
| Shots Against | 33.5 |
| Goals For | 3.1 |
| Goals Against | 2.8 |
| Hits | 26.5 |
| Shots Blocked | 10.2 |
| Pim | 9.3 |
| Date | Matchup | Result | Detail | |||||||||||
|---|---|---|---|---|---|---|---|---|---|---|---|---|---|---|
| Trade Deadline --- Trades can’t be done after this day is simulated! | ||||||||||||||
| Fri, Apr 19 | ROC | @ |  BNG | ROC3,BNG5 | RECAP | |||||||||
| Sun, Apr 21 | ROC | @ | BNG | ROC2,BNG3 | RECAP | |||||||||
| Tue, Apr 23 | BNG | @ | ROC | BNG4,ROC1 | RECAP | |||||||||
| Thu, Apr 25 | BNG | @ | ROC | BNG2,ROC3 | RECAP | |||||||||
| Sat, Apr 27 | ROC | @ | BNG | ROC3,BNG1 | RECAP | |||||||||
| Mon, Apr 29 | BNG | @ | ROC | BNG4,ROC3 | RECAP | |||||||||
| Fri, May 3 | LVL | @ | BNG | LVL1,BNG6 | RECAP | |||||||||
| Sun, May 5 | LVL | @ | BNG | LVL5,BNG0 | RECAP | |||||||||
| Tue, May 7 | BNG | @ | LVL | BNG3,LVL4 | RECAP | |||||||||
| Thu, May 9 | BNG | @ | LVL | BNG6,LVL4 | RECAP | |||||||||
| Sat, May 11 | LVL | @ | BNG | LVL4,BNG3 (OT) | RECAP | |||||||||
| Mon, May 13 | BNG | @ | LVL | BNG0,LVL1 | RECAP | |||||||||
| Salary Cap | |||
|---|---|---|---|
| Players Total Salaries | Retained Salary | Total Cap Hit | Estimated Cap Space |
| 2,534,079$ | 0$ | 0$ | 75,000,000$ |
| Arena | About us | |
|---|---|---|

| Name | |
| City | Binghamton | |
| Capacity | 3000 | |
| Season Ticket Holders | 10% | |
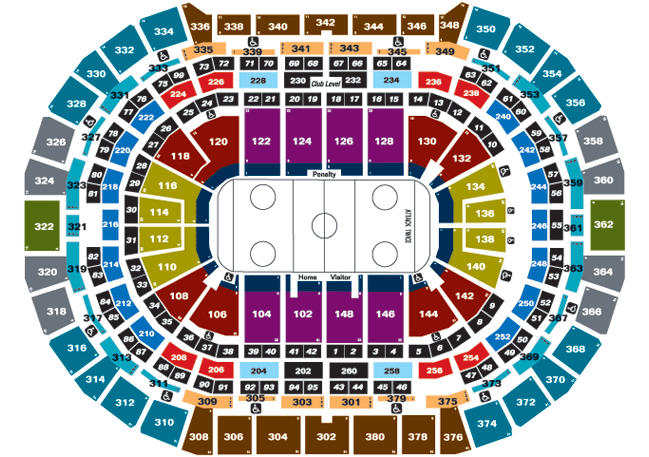
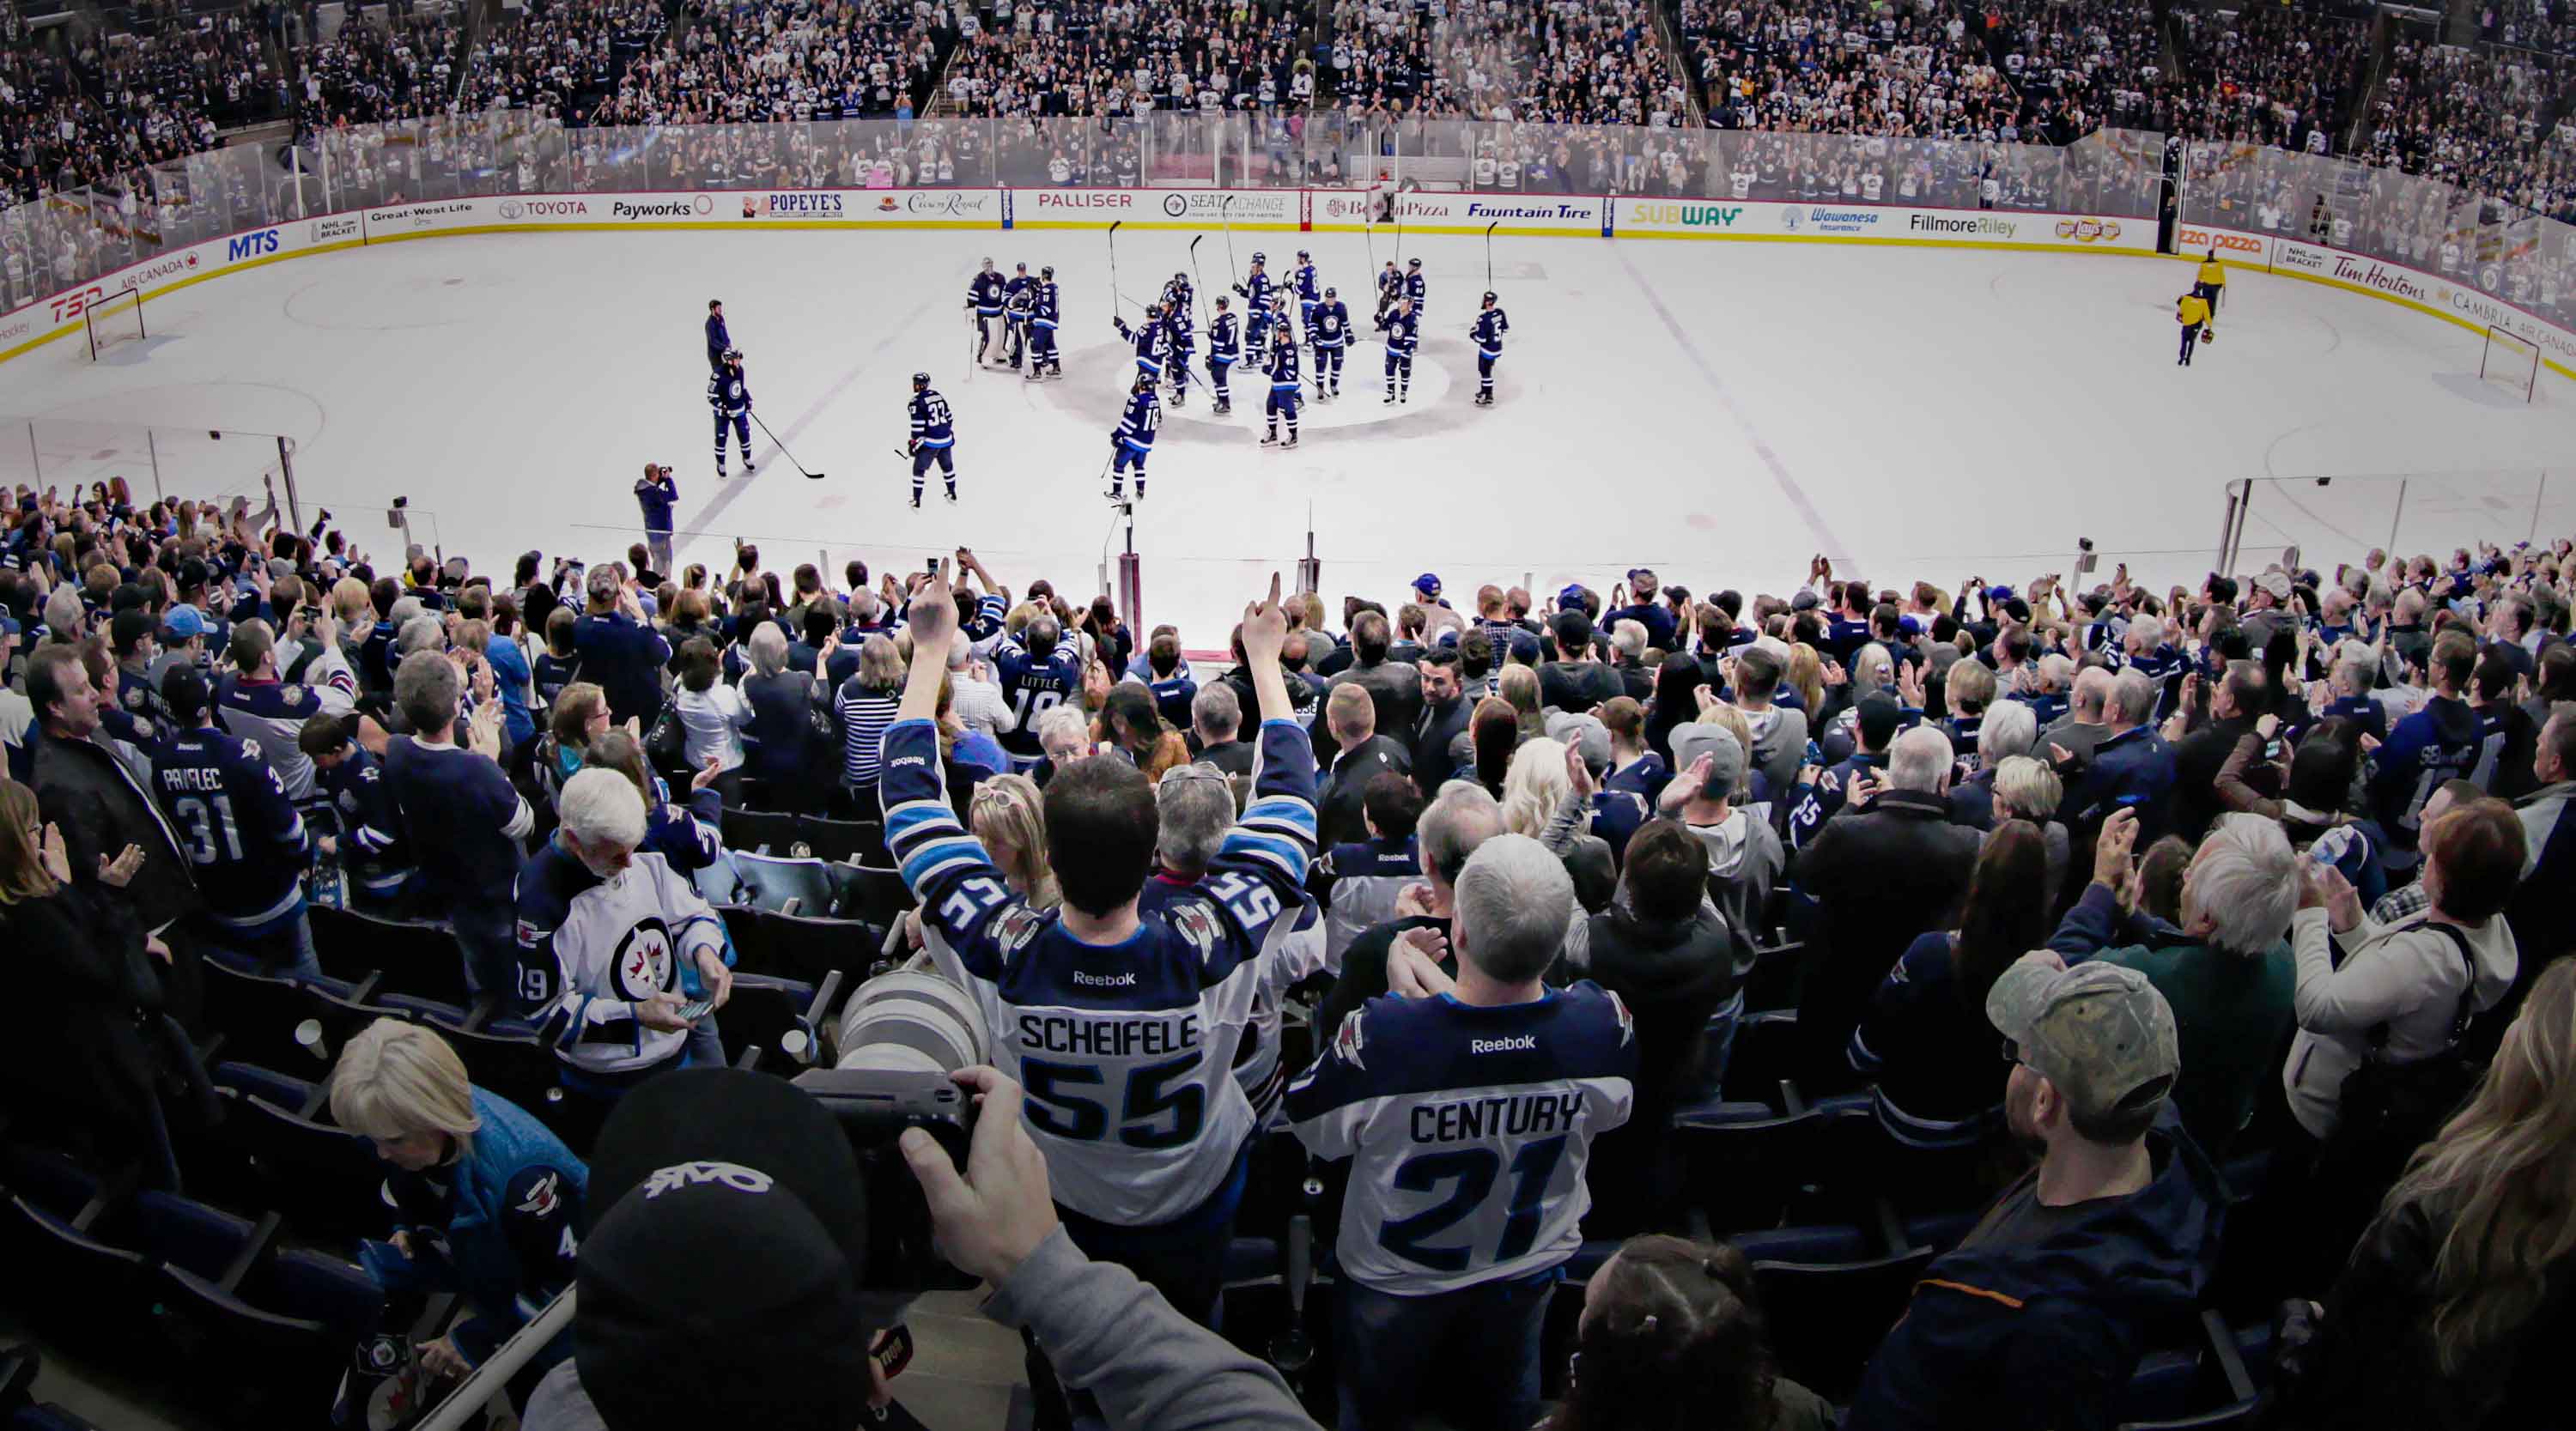
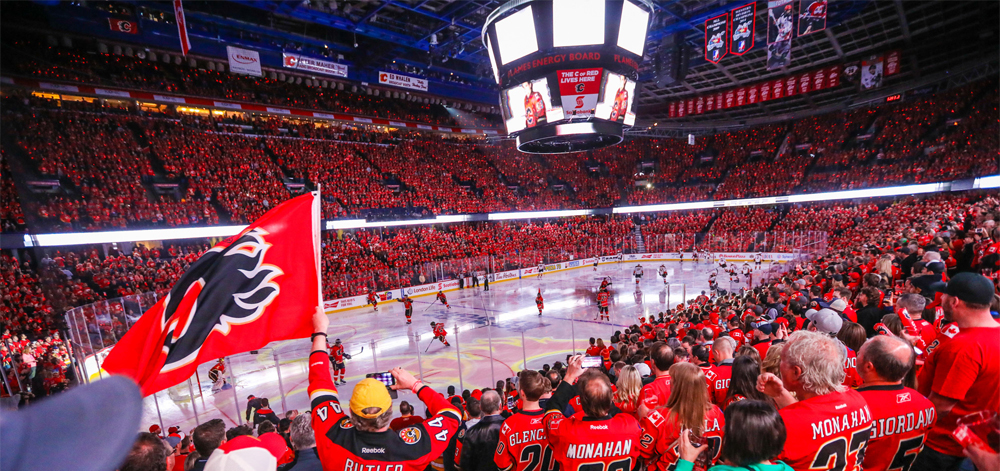
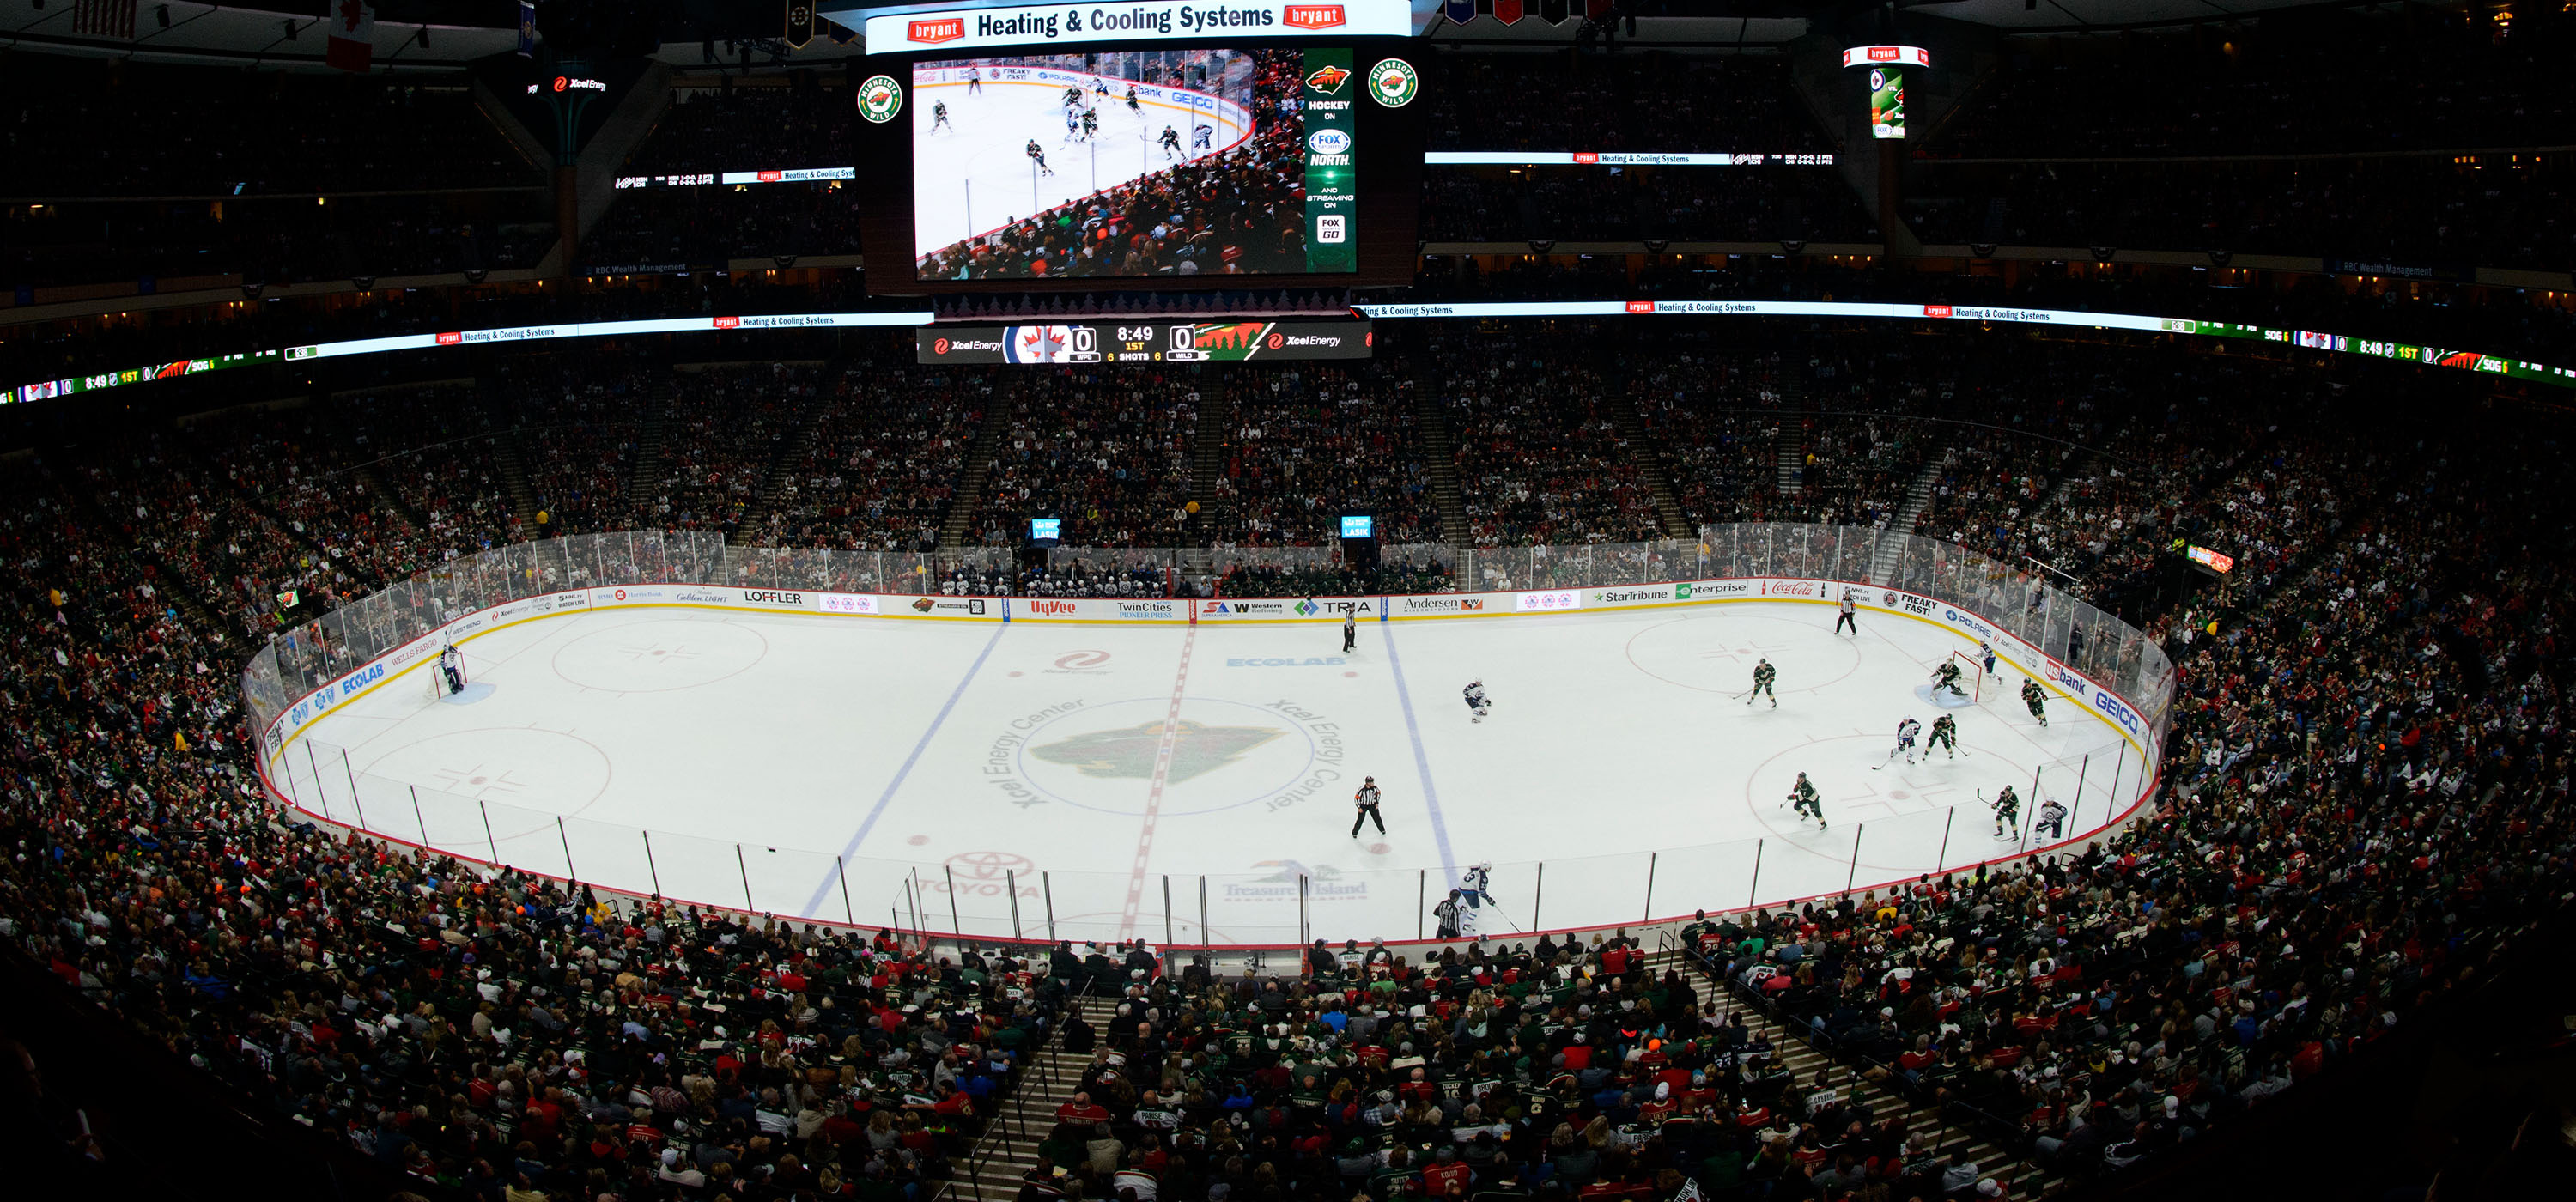
| Arena Capacity - Ticket Price Attendance - % | |||||
|---|---|---|---|---|---|
 |
 |
 |
 |
 |
 |
| Arena Capacity | 2000 | 1000 | |||
| Ticket Price | 40$ | 20$ | $ | $ | $ |
| Attendance | 9577 | 4895 | |||
| Attendance PCT | 79.81% | 81.58% | 0.00% | 0.00% | 0.00% |
| Income | |||||
|---|---|---|---|---|---|
 |
 |
 |
 |
 |
|
| Home Games Left | Average Attendance - % | Average Income per Game | Year to Date Revenue | Arena Capacity | Team Popularity |
| 35 | 2412 - 80.40% | 119,444$ | 716,661$ | 3000 | 100 |
| Expenses | |||
|---|---|---|---|
| Players Total Salaries | Players Total Average Salaries | Coaches Salaries | Special Salary Cap Value |
| 2,534,079$ | 2,534,219$ | 0$ | 0$ |
| Year To Date Expenses | Salary Cap Per Days | Salary Cap To Date | Luxury Taxe Total |
|---|---|---|---|
| 0$ | 0$ | 0$ | 0$ |
| Estimate | |||
|---|---|---|---|
| Estimated Season Revenue | Remaining Season Days | Expenses Per Days | Estimated Season Expenses |
| 0$ | 0 | 0$ | 0$ |
| Team Total Estimate | |||
|---|---|---|---|
| Estimated Season Expenses | Estimated Season Salary Cap | Current Bank Account | Projected Bank Account |
| 0$ | 0$ | 0$ | 0$ |
| Sponsors | |||
|---|---|---|---|
| TV Rights | Primary Sponsor | Secondary Sponsor | Secondary Sponsor |

| 
| 
| 
|
 Rookie
 Injured
 Cold Streak
 Hot Streak
| Left Wing | Center | Right Wing |
|---|---|---|
|
|
|
|
| Defense #1 | Defense #2 | Goalie |
|---|---|---|
|
|
|
| ||||||||||||||||||||||||||||||||||||||


 ***Bonne chance pour le reste de saison***
 Last update: 2024-06-03 18:02:00